DRF API Logger



The production standard for DRF API observability: request/response logging, profiling, masking, and admin analytics for Django REST Framework.
Use DRF API Logger when you need to inspect API calls without writing fragile custom middleware. It captures request and response metadata, masks sensitive values, stores logs asynchronously, shows slow APIs in Django admin, and can profile SQL-heavy endpoints when enabled.
Key Features
Request details: URL, method, headers, body, and client IP
Response information: status code, response body, and execution time
Automatic masking of sensitive data (passwords, tokens)
Non-blocking background processing with configurable queuing
ASGI-native logging while preserving sync deployment compatibility
Database logging and/or real-time signal notifications
Built-in admin dashboard with charts and performance metrics
Per-request API profiling with auto-diagnosis of bottlenecks
Request correlation through request attributes, logging context, and signals
Optional Prometheus, OpenTelemetry, and Sentry helper functions with safe defaults
Optional first-party metrics for logger health, pipeline behavior, API timing, and detect-only security signals
Optional endpoint-specific policy controls for logging, masking, payload stripping, and signal/export gating
Supported Versions
Python 3.10+
Django 4.2+
Django REST Framework 3.16+
The release workflow tests representative Django versions from this support range before publishing package artifacts.
Getting Started
Installation
pip install drf-api-logger
Configuration
Add drf_api_logger to your INSTALLED_APPS:
INSTALLED_APPS = [
    # ... your other apps
    'drf_api_logger',
]
Add the middleware:
MIDDLEWARE = [
    # ... your other middleware
    'drf_api_logger.middleware.api_logger_middleware.APILoggerMiddleware',
]
Run migrations (required for database logging):
python manage.py migrate
Database Logging
Enable database storage for API logs:
# settings.py
DRF_API_LOGGER_DATABASE = True  # Default: False
Logs will be available in the Django Admin Panel with search, filtering, and analytics charts. Admin graphs are collapsed by default and loaded on demand when opened, keeping the log list fast and focused during routine investigation. Each graph has its own control and fetches its backend data only when opened; graph data requests time out after 30 seconds.
Note
Make sure to run python manage.py migrate after enabling database logging.
Admin Dashboard
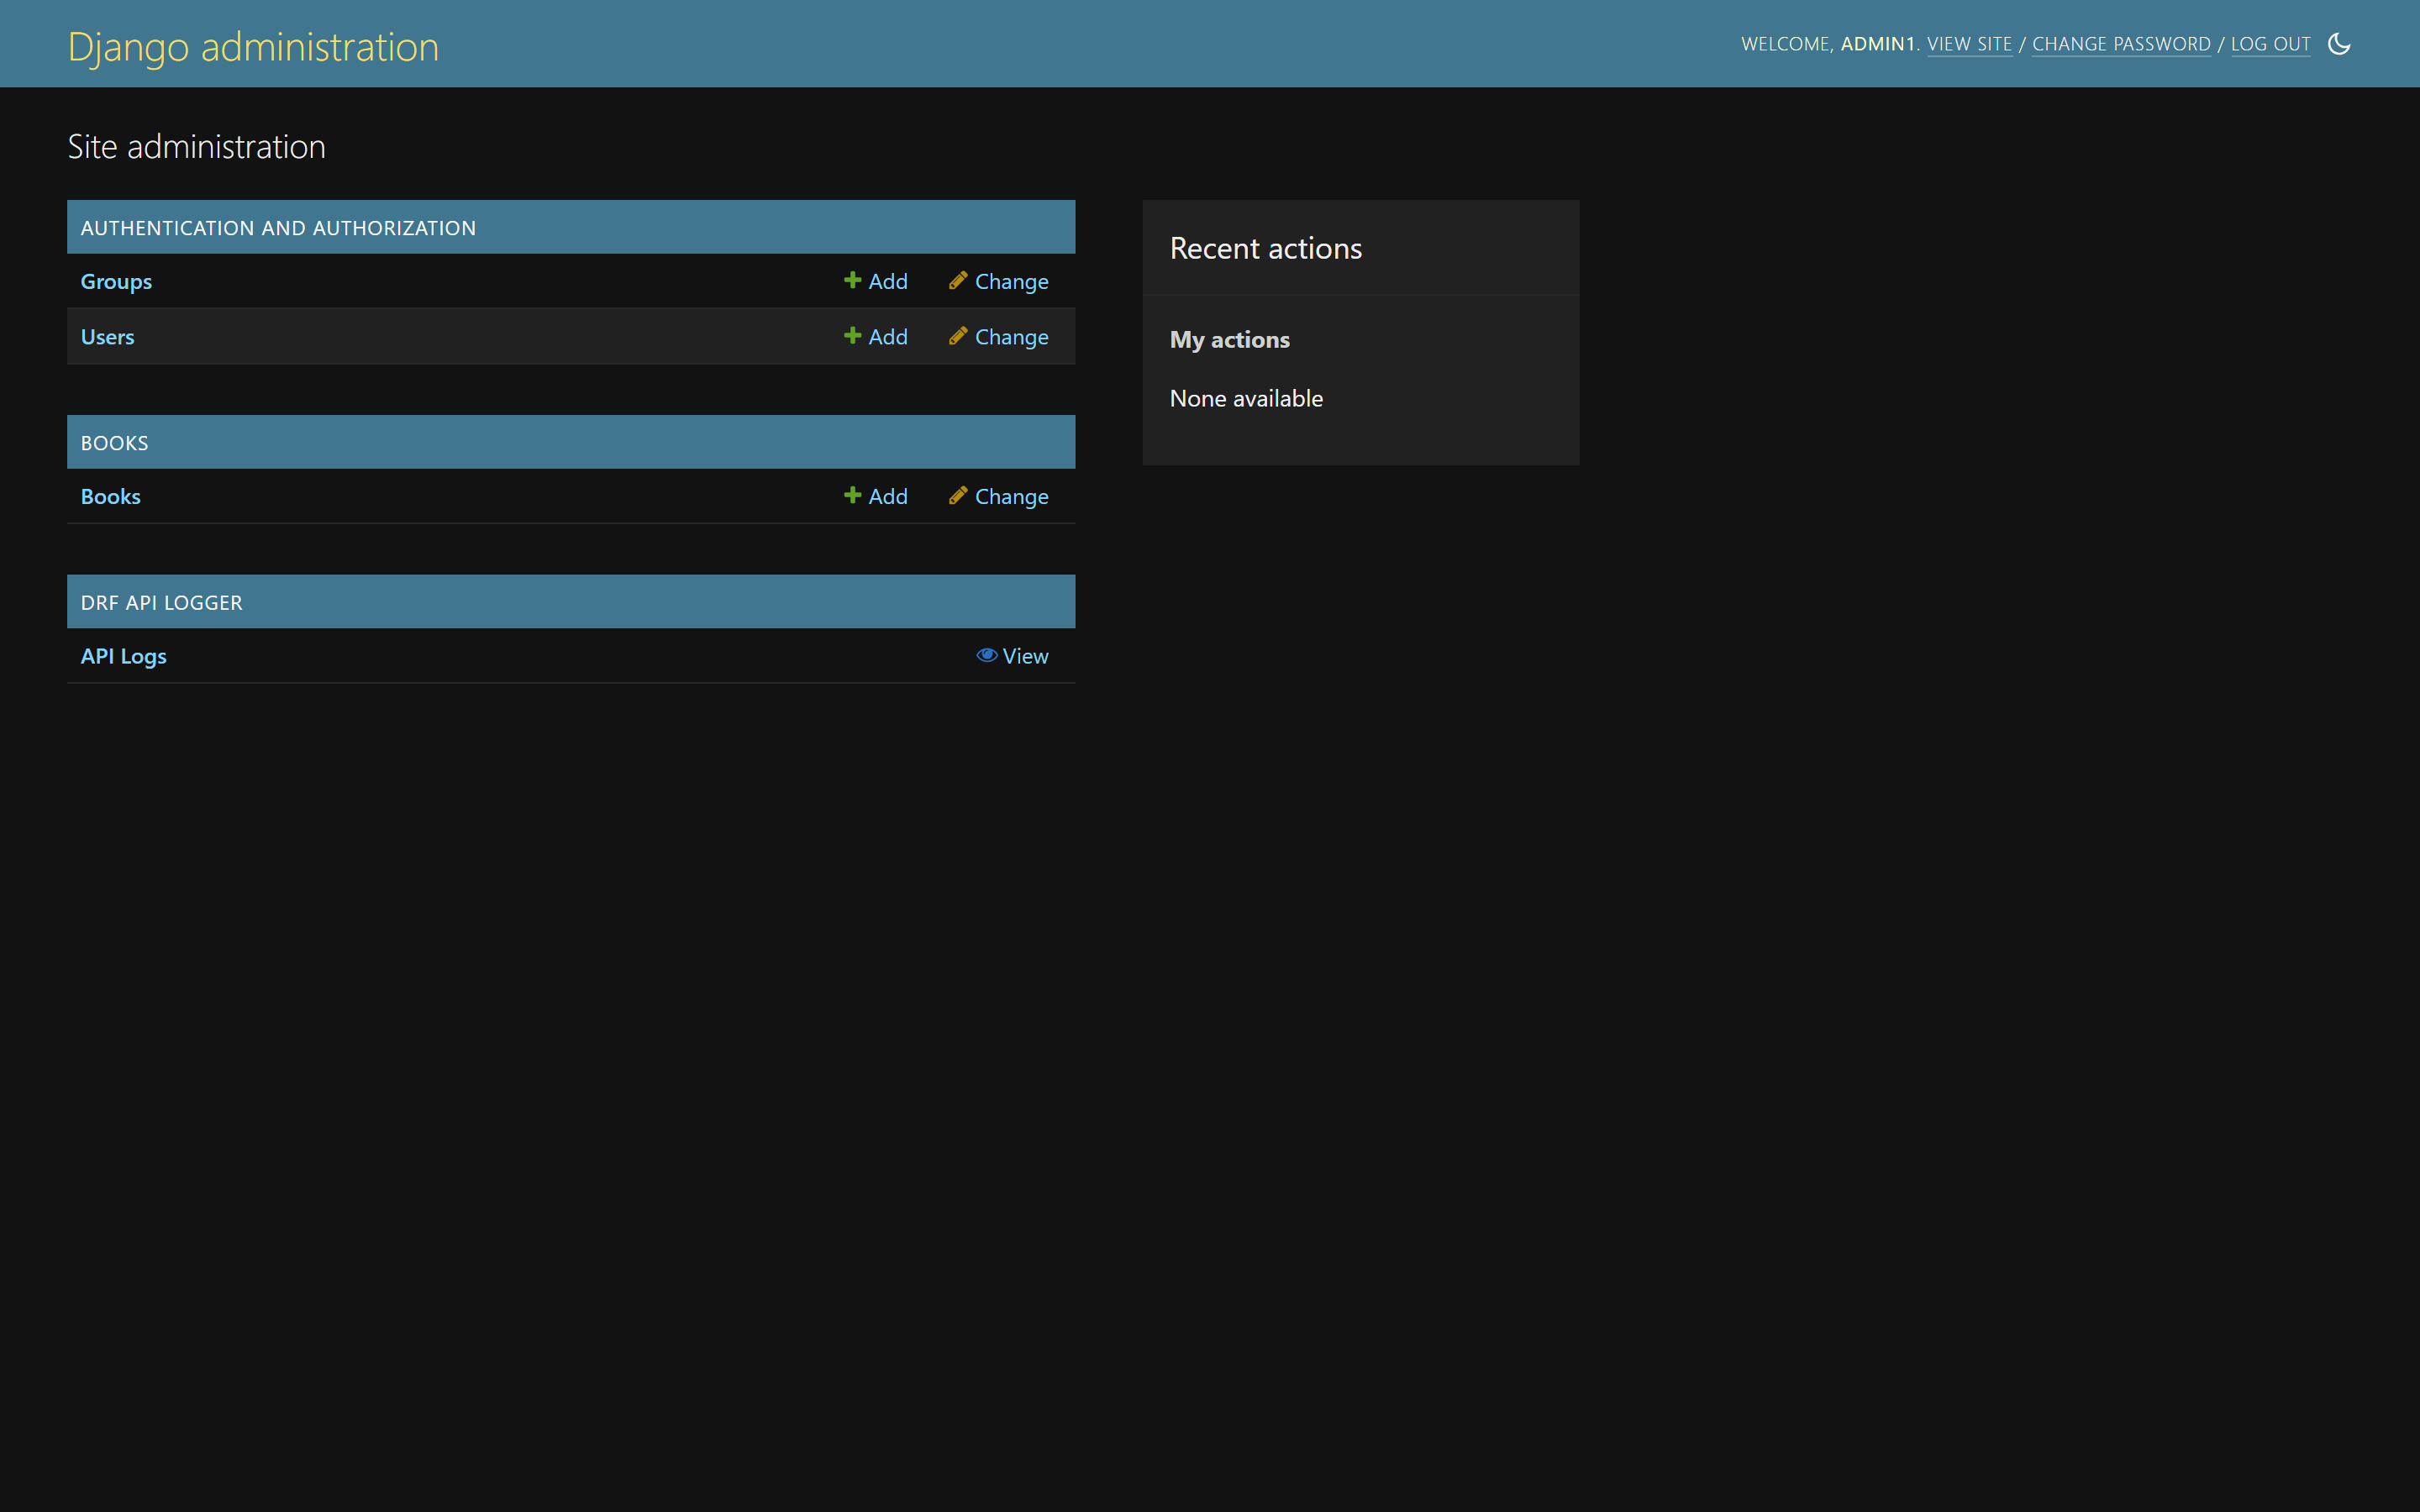
The DRF API Logger section appears in the Django admin home page.
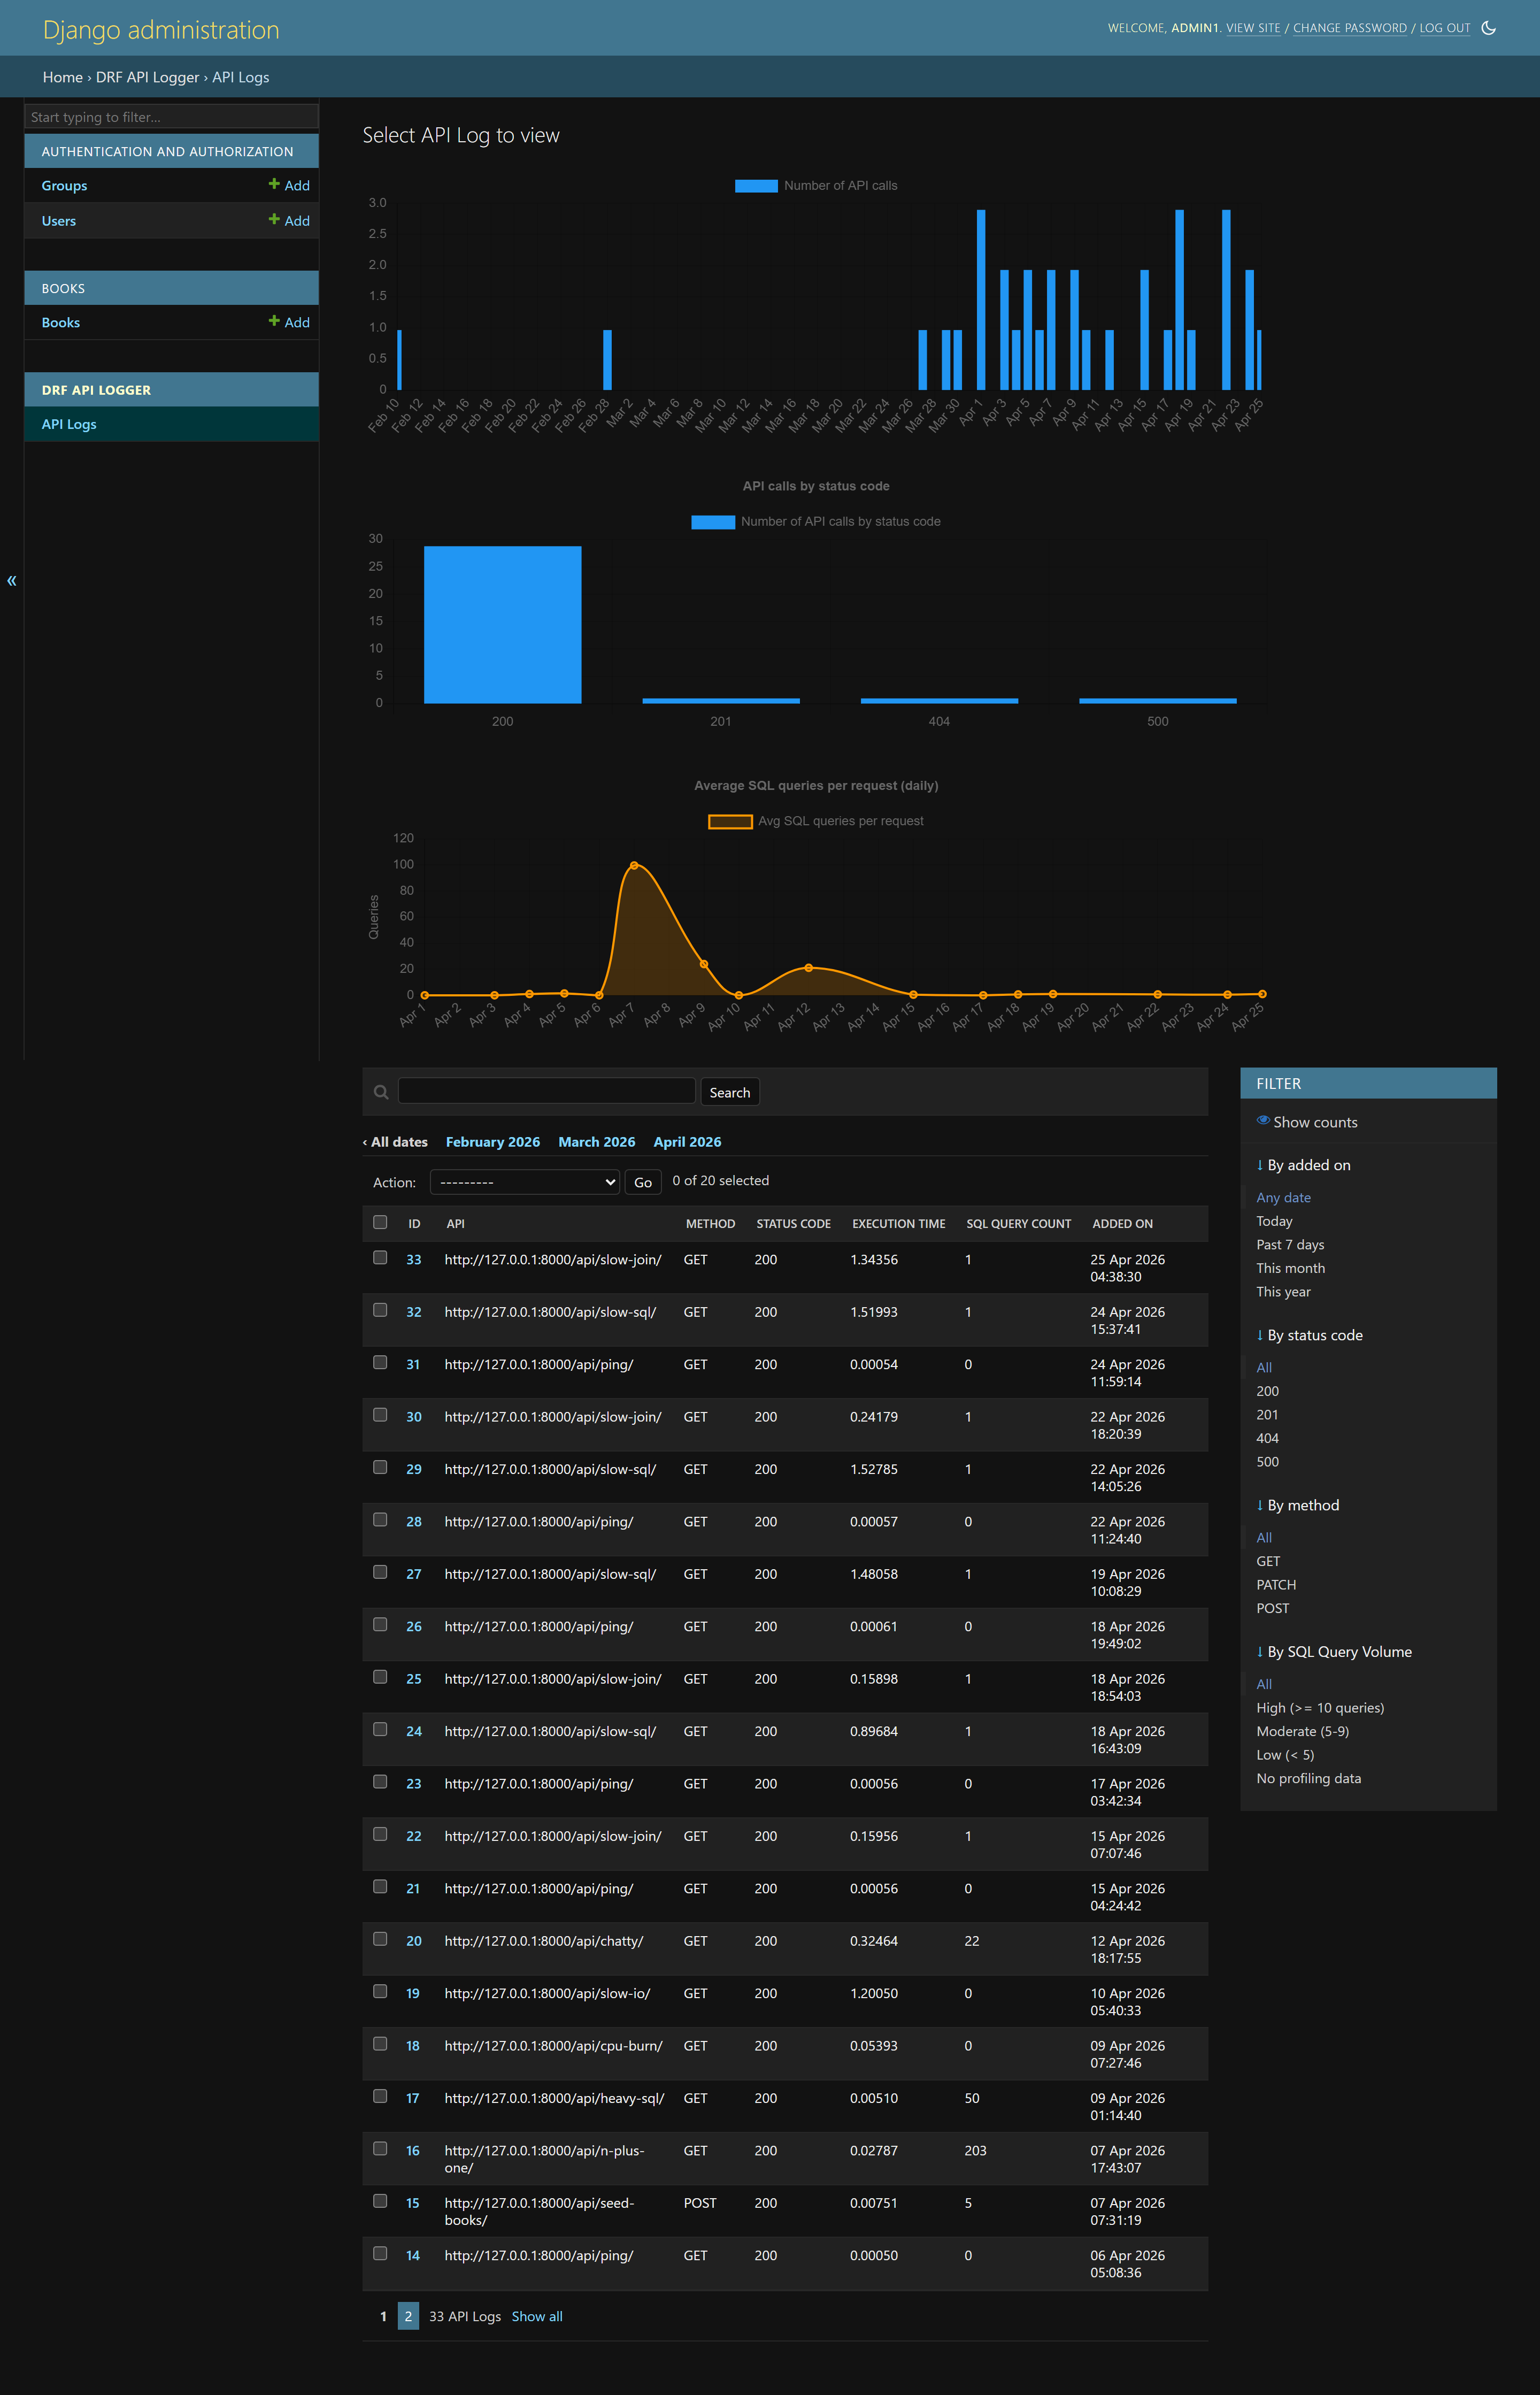
Log listing with charts for API call volume, status code distribution, and SQL query averages. Filter by date, status code, method, and SQL query volume.
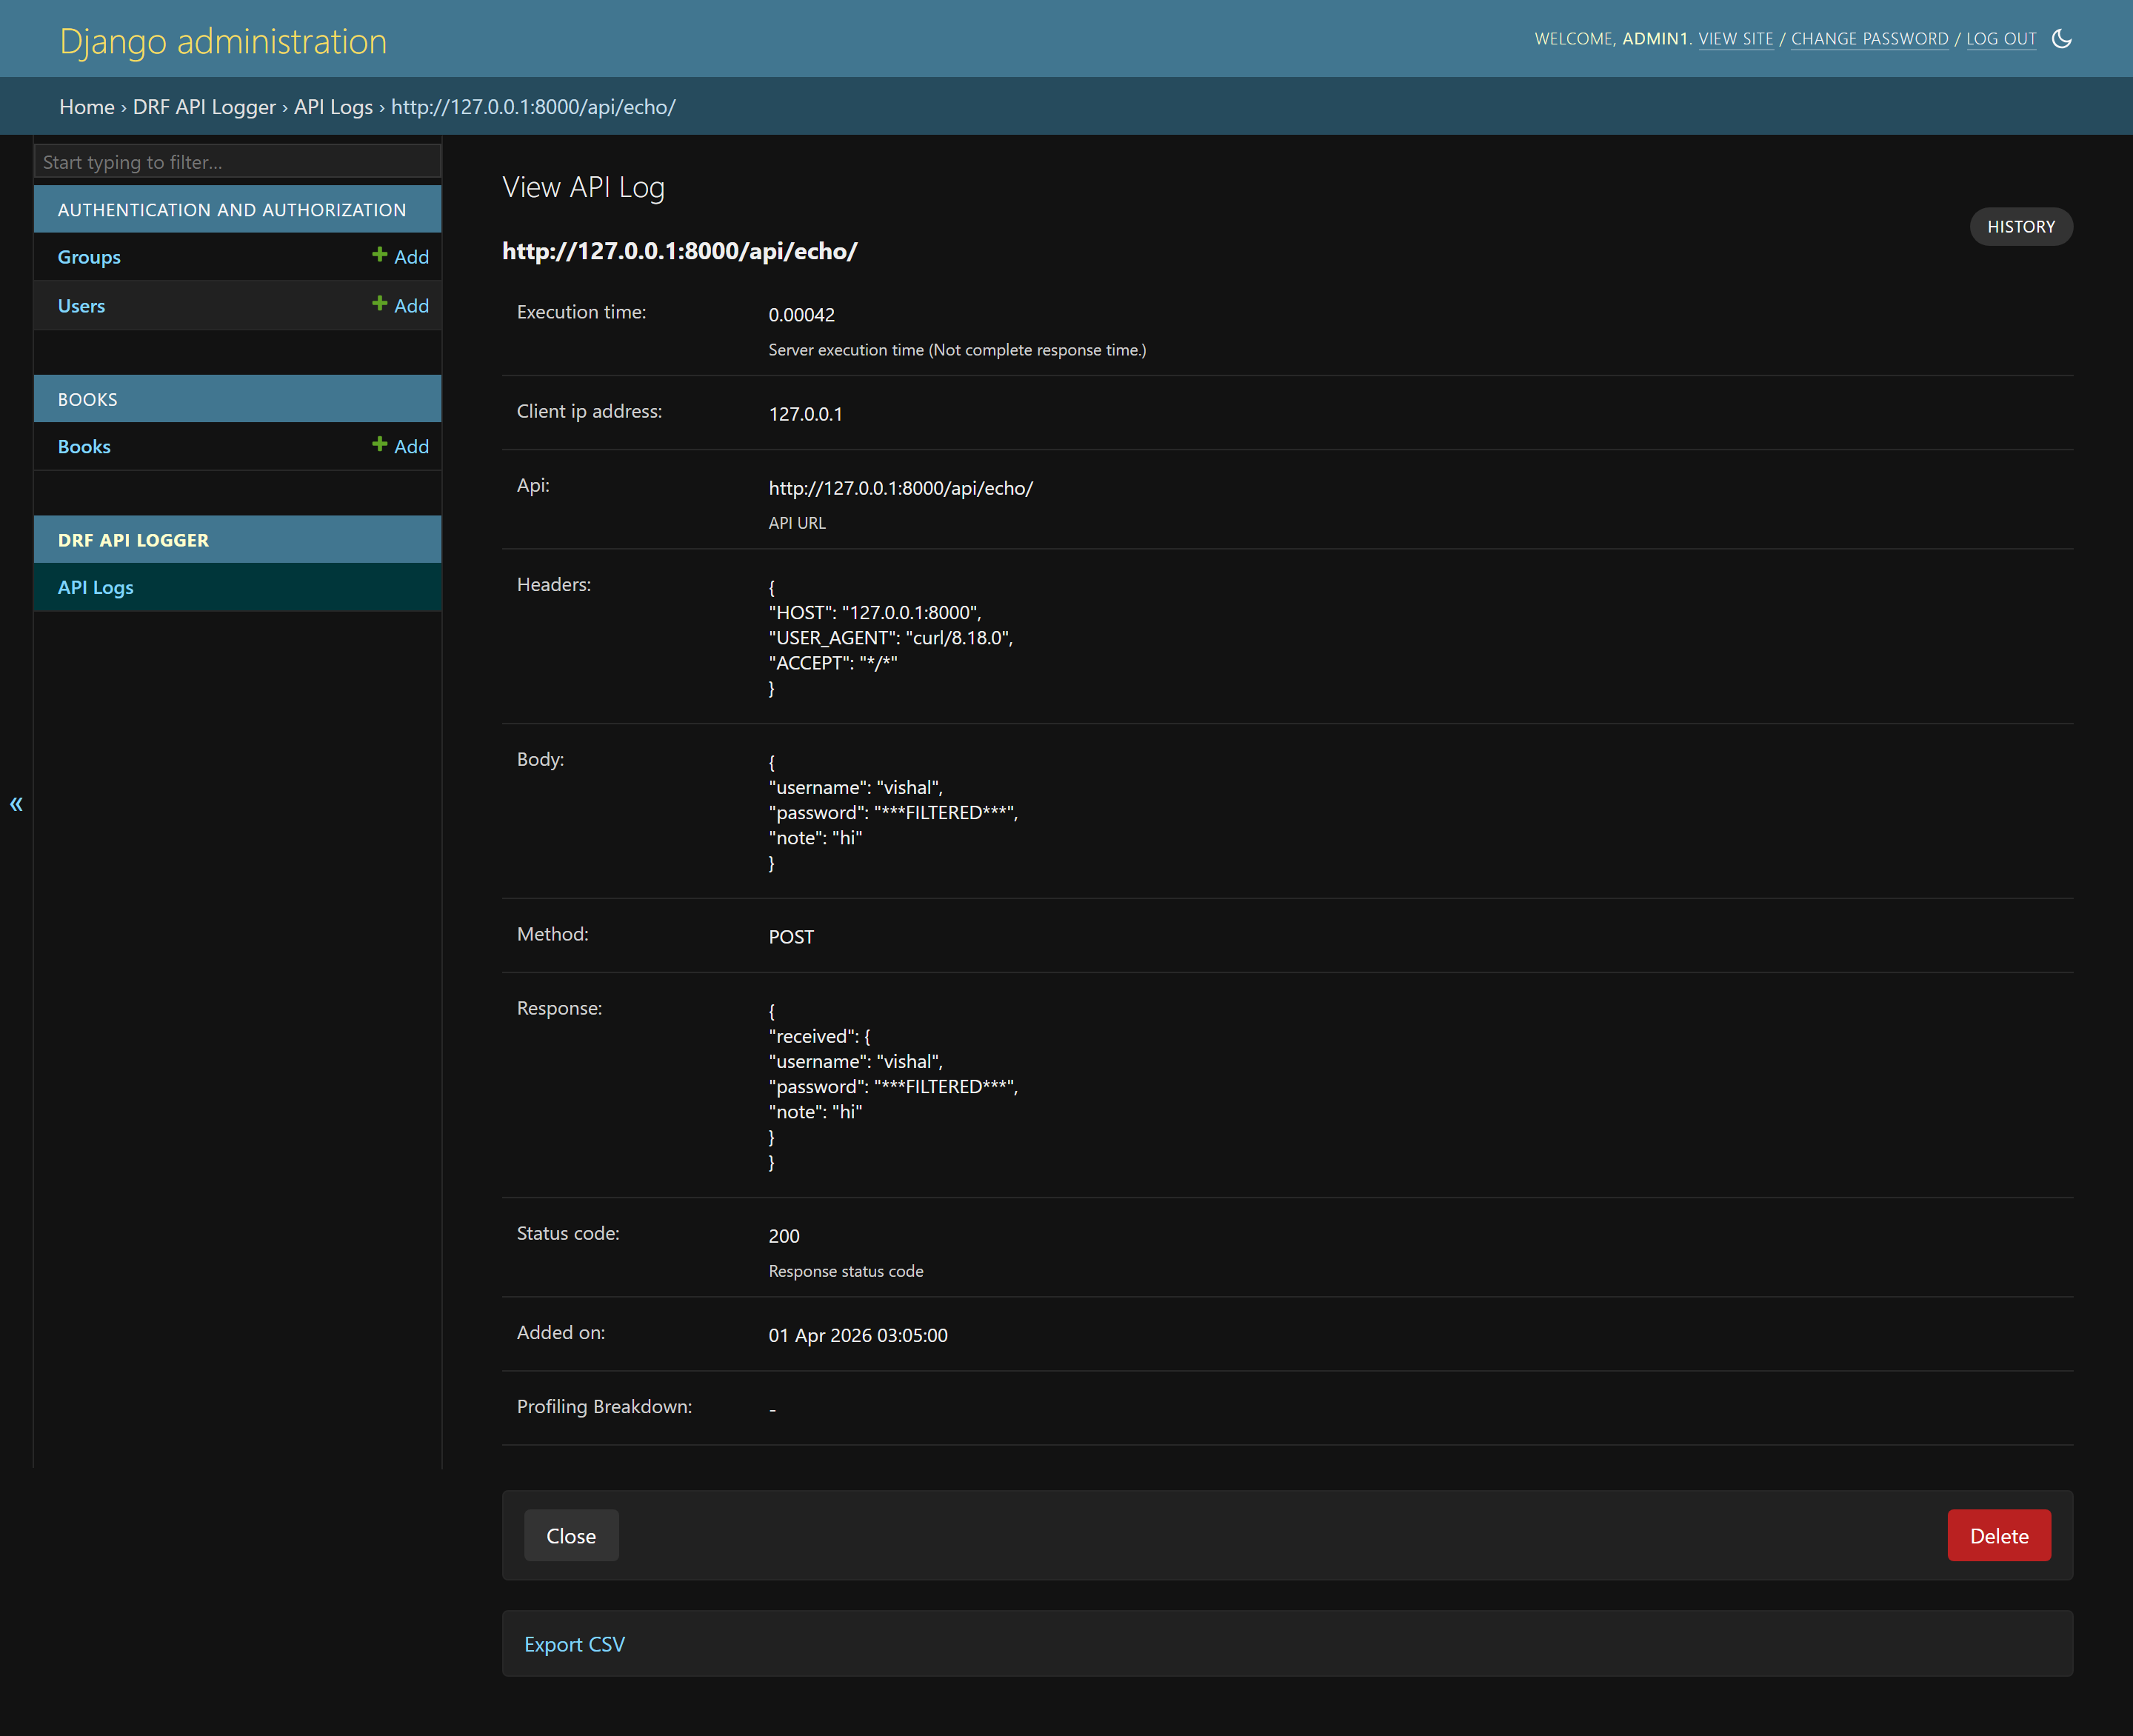
Detailed log view showing request/response data with sensitive fields automatically masked.
Signal-Based Logging
Enable real-time signal notifications for custom logging:
# settings.py
DRF_API_LOGGER_SIGNAL = True  # Default: False
Subscribe to signals:
from drf_api_logger import API_LOGGER_SIGNAL

def listener_one(**kwargs):
    print(kwargs)

def listener_two(**kwargs):
    print(kwargs)

# Subscribe
API_LOGGER_SIGNAL.listen += listener_one
API_LOGGER_SIGNAL.listen += listener_two

# Unsubscribe
API_LOGGER_SIGNAL.listen -= listener_one
Signal data structure:
{
    'api': '/api/resources/',
    'method': 'POST',
    'status_code': 201,
    'headers': {'Content-Type': 'application/json'},
    'body': {'username': 'example_user', 'password': '***FILTERED***'},
    'response': {'id': 1, 'username': 'example_user'},
    'client_ip_address': '203.0.113.10',
    'execution_time': 0.142,
    'added_on': datetime.now(),
    'tracing_id': 'uuid4-string',       # if tracing enabled
    'profiling_data': { ... },           # if profiling enabled
    'sql_query_count': 5,                # if profiling enabled
    'correlation': { ... },              # if correlation enabled
    'low_cardinality': { ... },          # if correlation enabled
}
API Profiling
Enable per-request latency breakdown to identify performance bottlenecks in production without attaching a profiler:
# settings.py
DRF_API_LOGGER_ENABLE_PROFILING = True            # Default: False
DRF_API_LOGGER_PROFILING_SQL_TRACKING = True       # Default: True
DRF_API_LOGGER_PROFILING_SAMPLE_RATE = 1.0         # Default: 1.0
When enabled, each logged request includes a profiling breakdown showing:
Middleware time (before and after view)
View + Serialization time
SQL time and query count (production-safe via
connection.force_debug_cursor)Auto-diagnosis hints for common performance issues
For high-traffic systems, reduce DRF_API_LOGGER_PROFILING_SAMPLE_RATE to
profile only a fraction of logged requests.
Slow SQL Query Detection
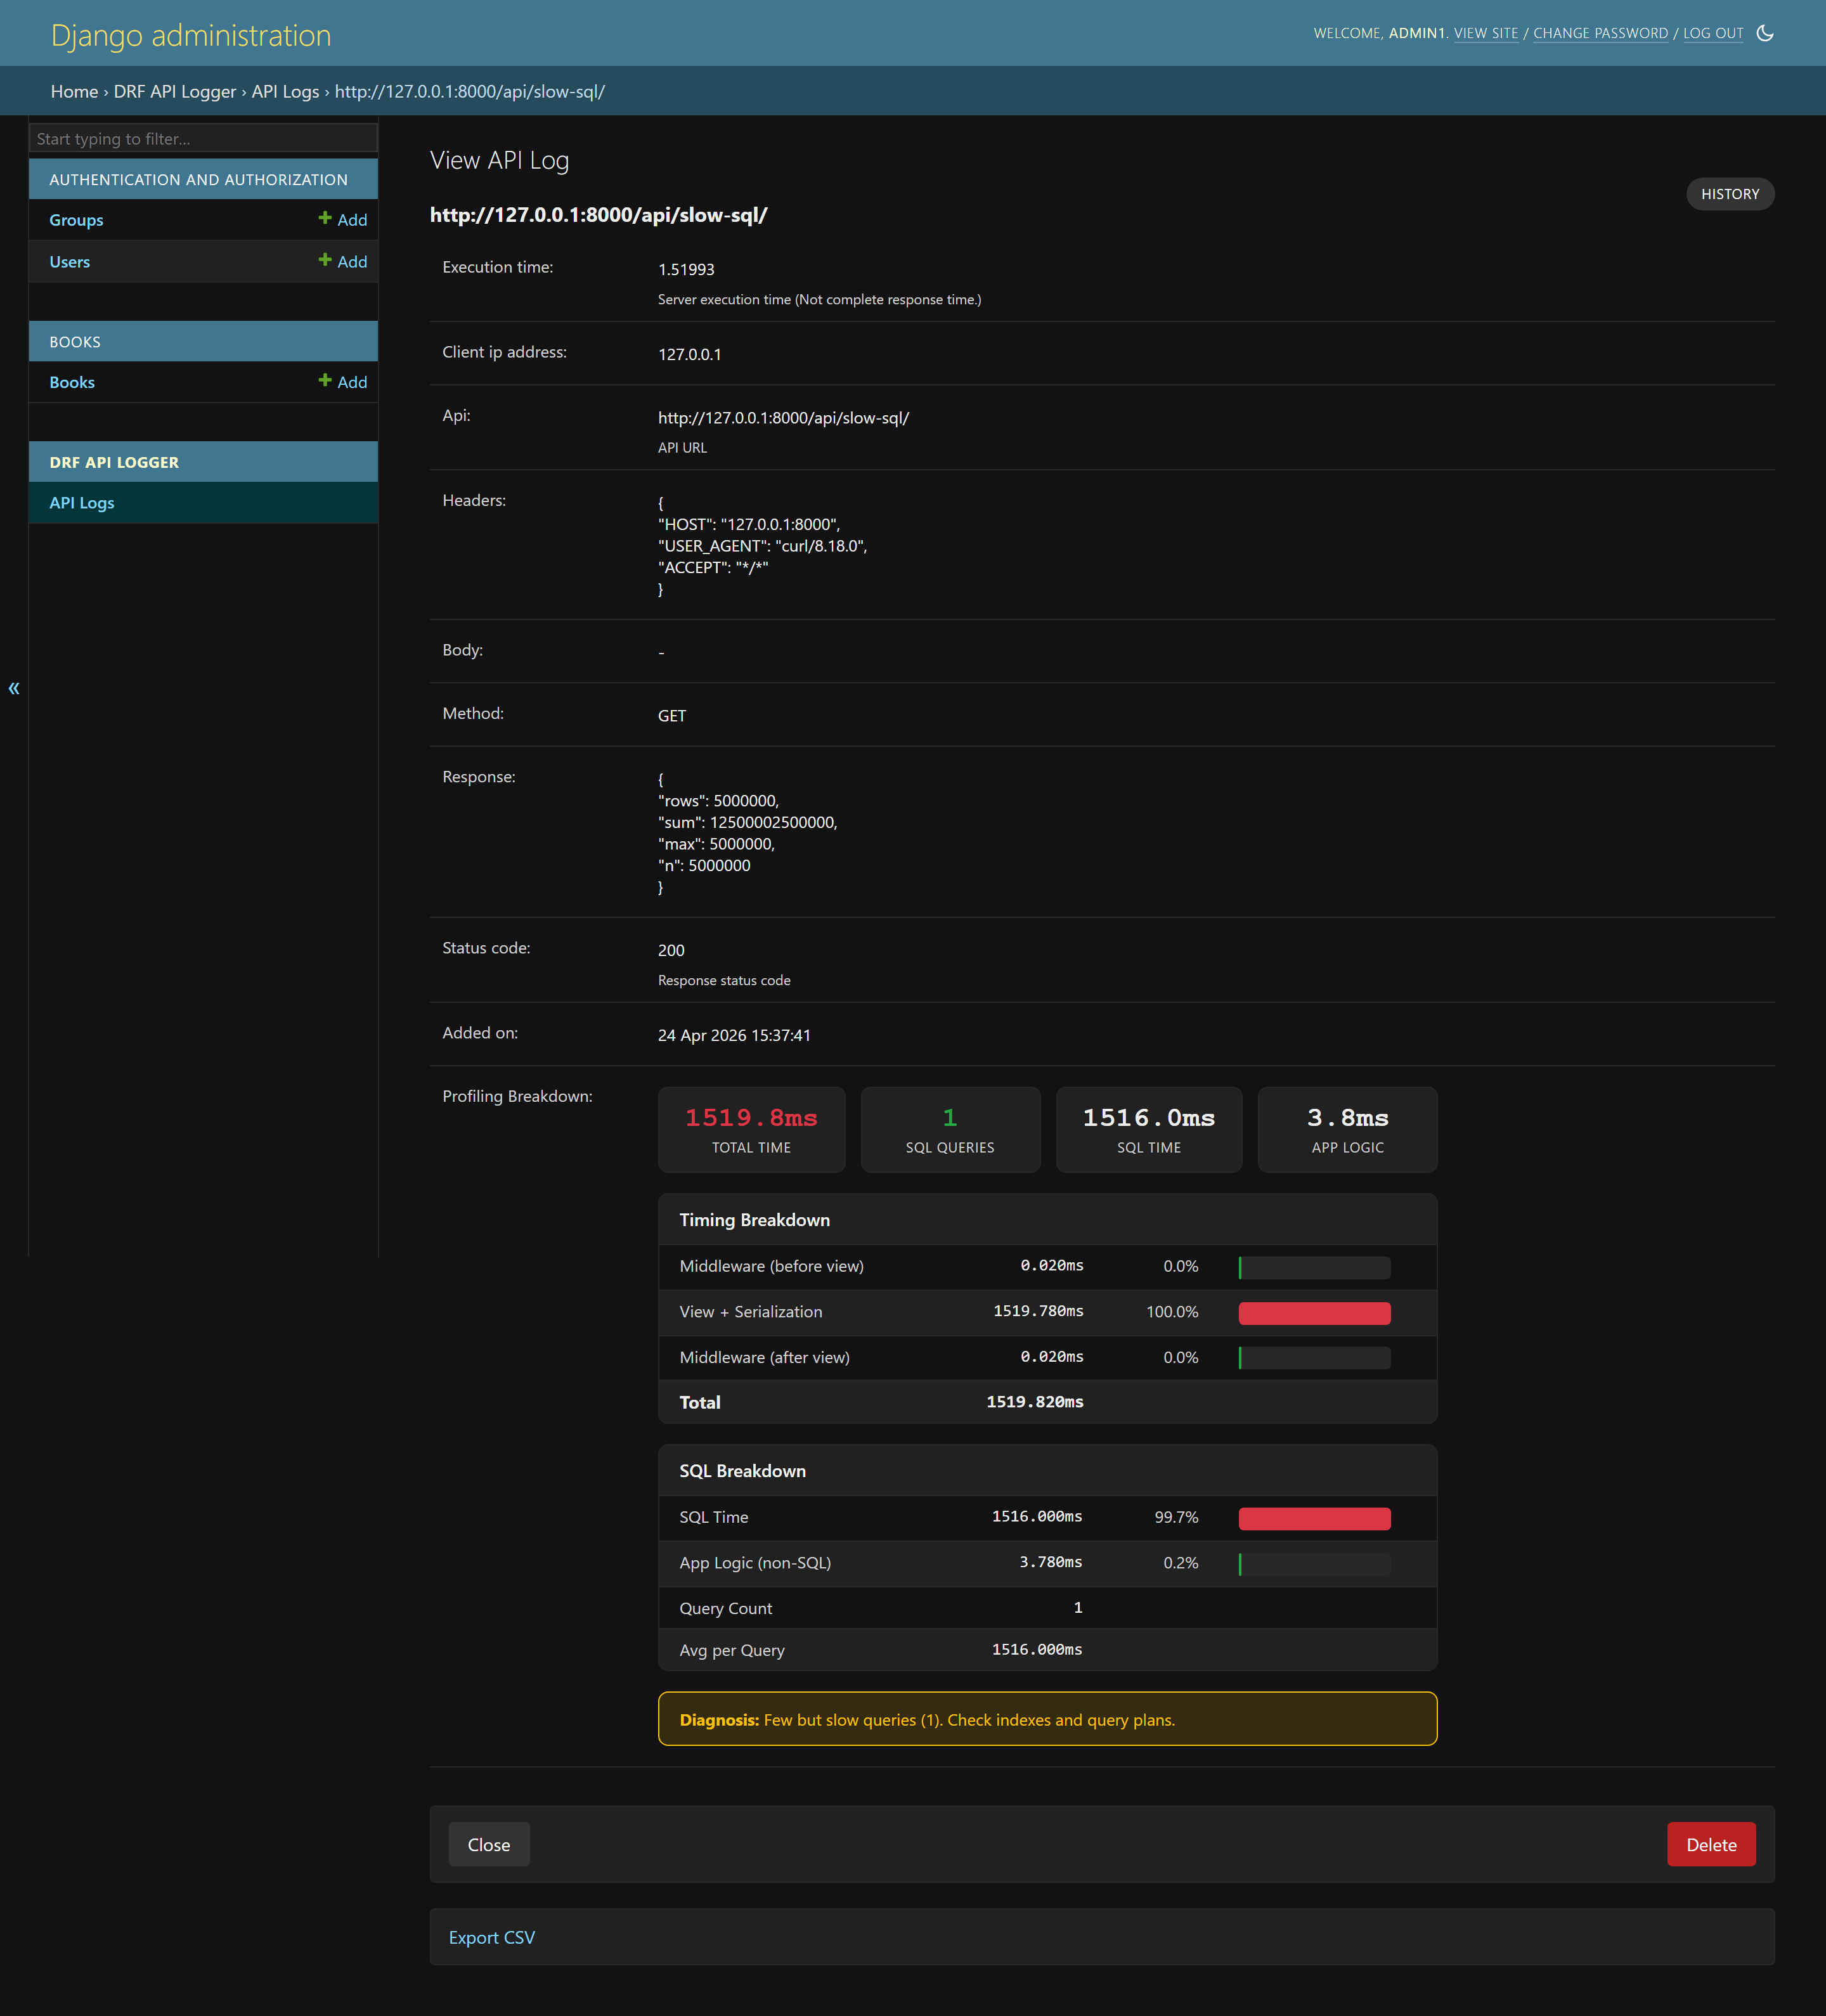
A single query taking 1516ms. Diagnosis: “Few but slow queries. Check indexes and query plans.”
N+1 Query Detection
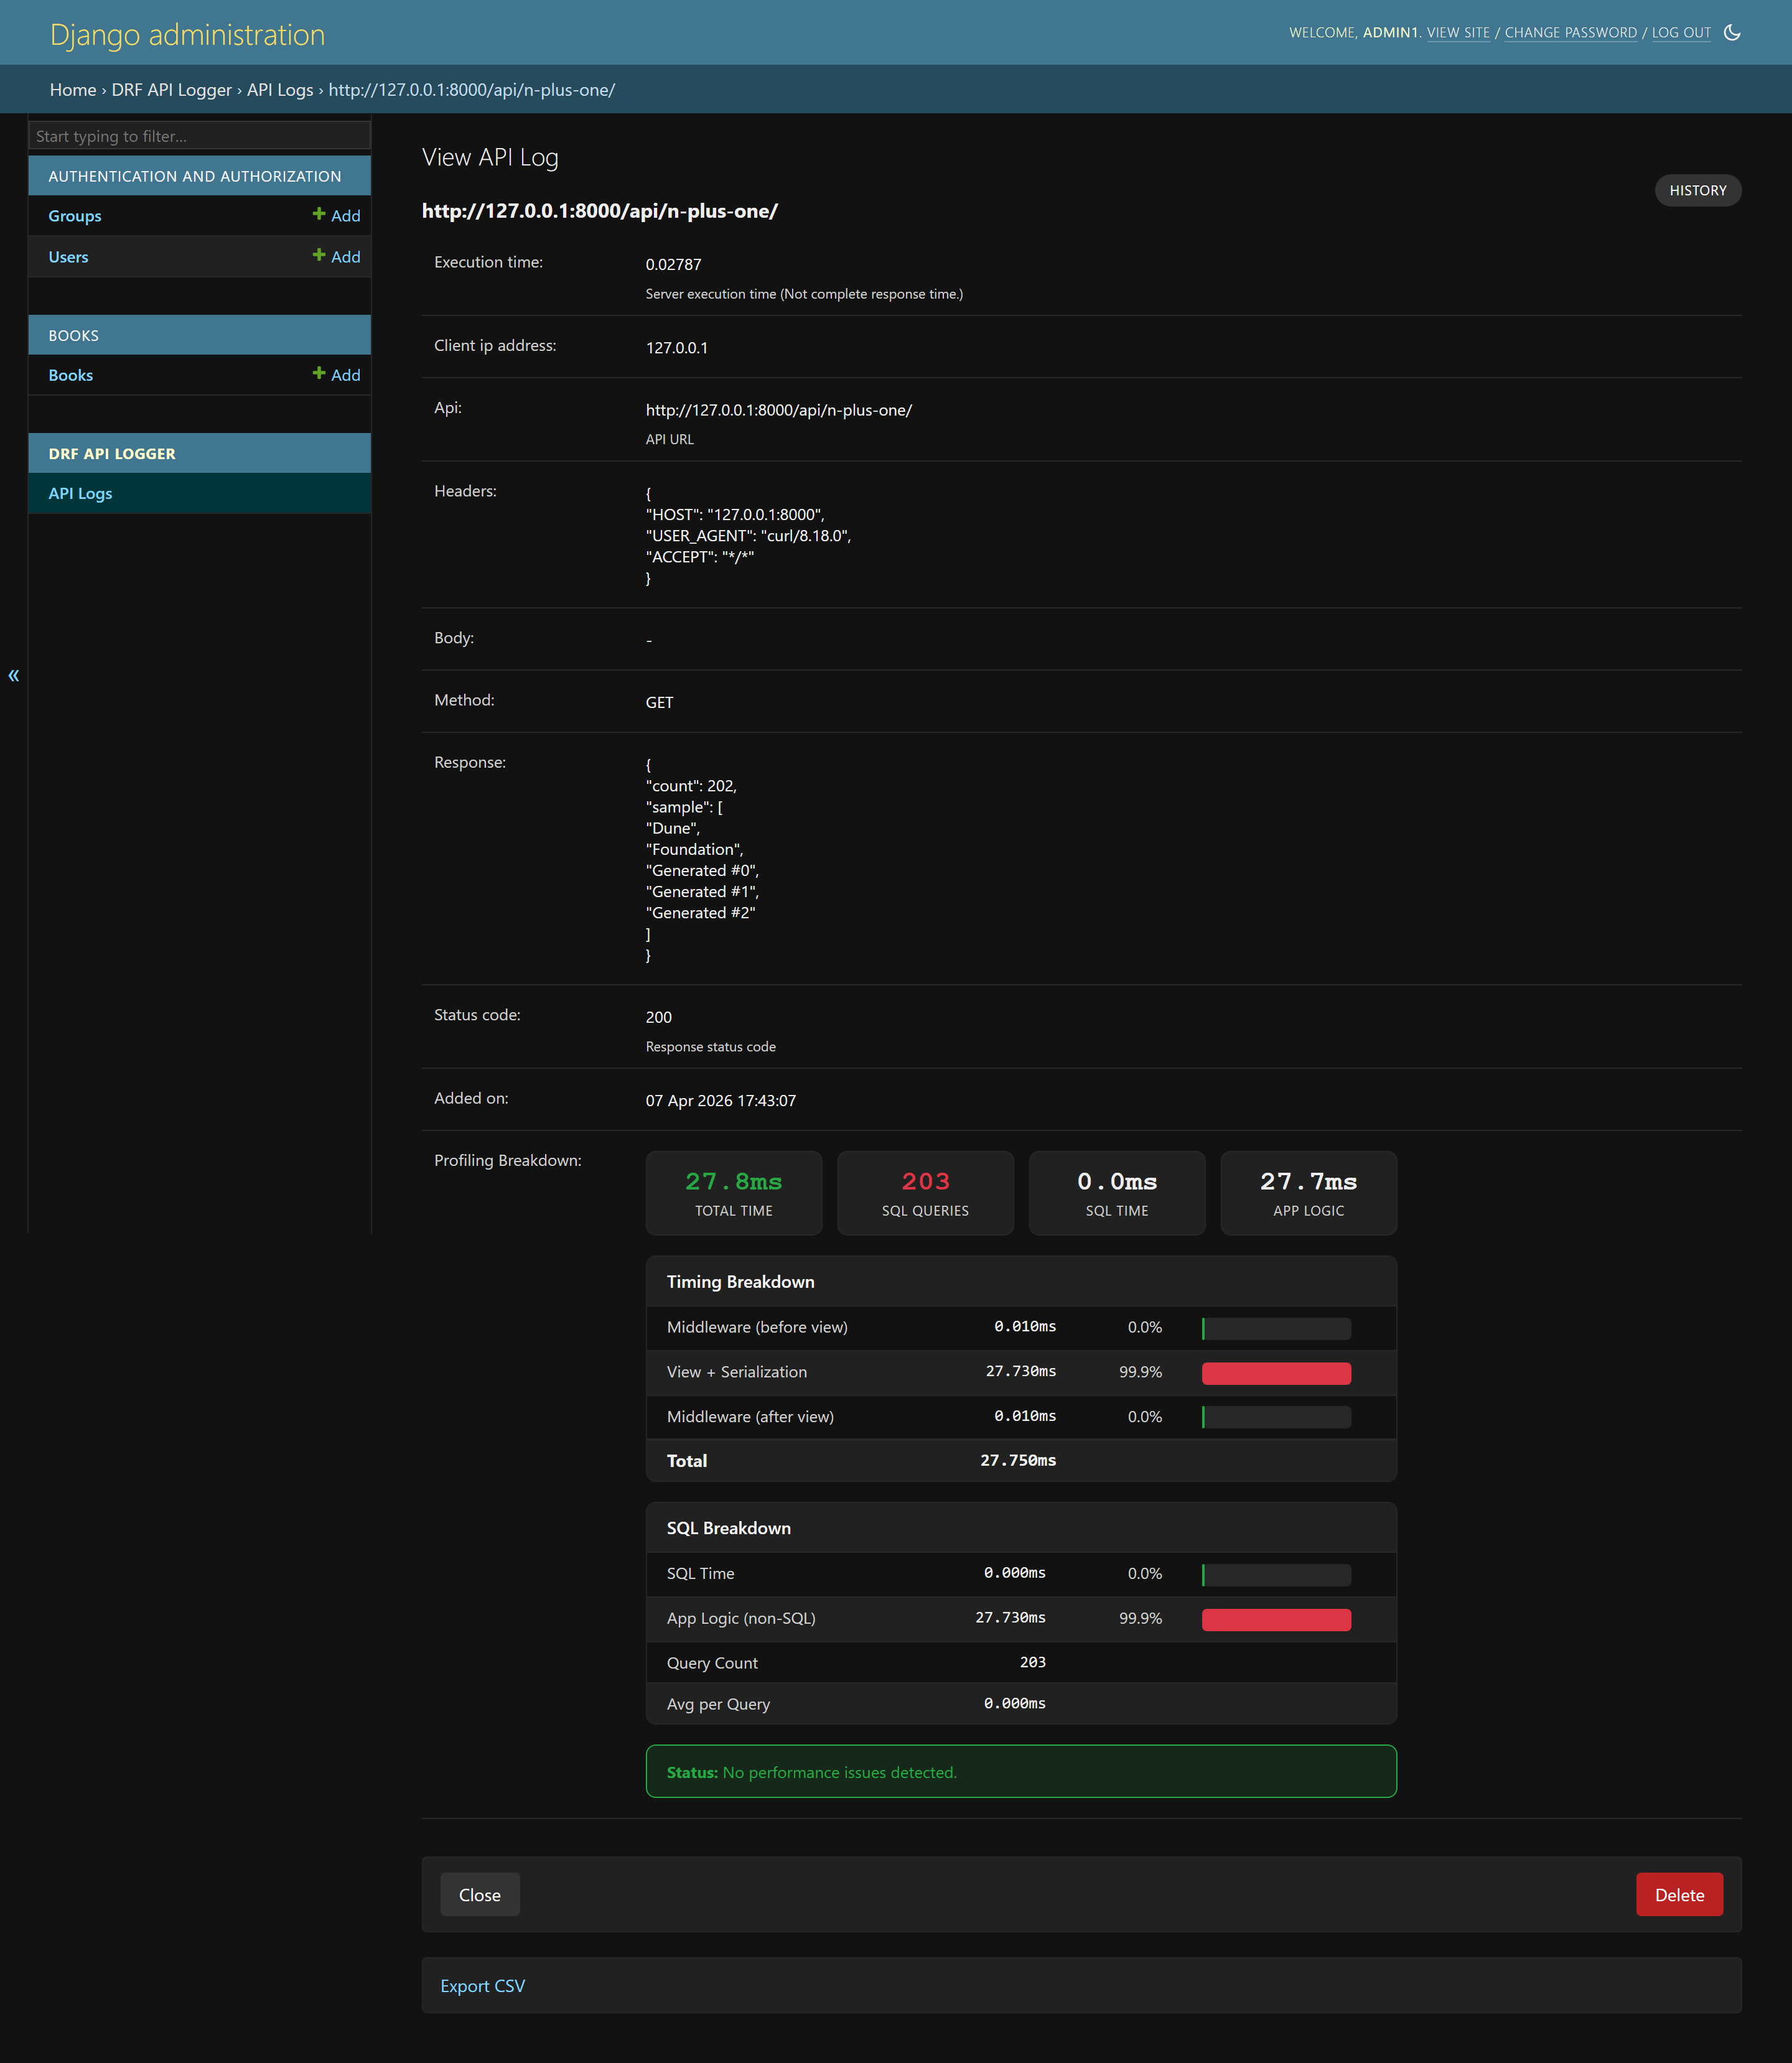
203 SQL queries detected. Diagnosis: “N+1 query problem likely.”
Middleware Overhead Detection
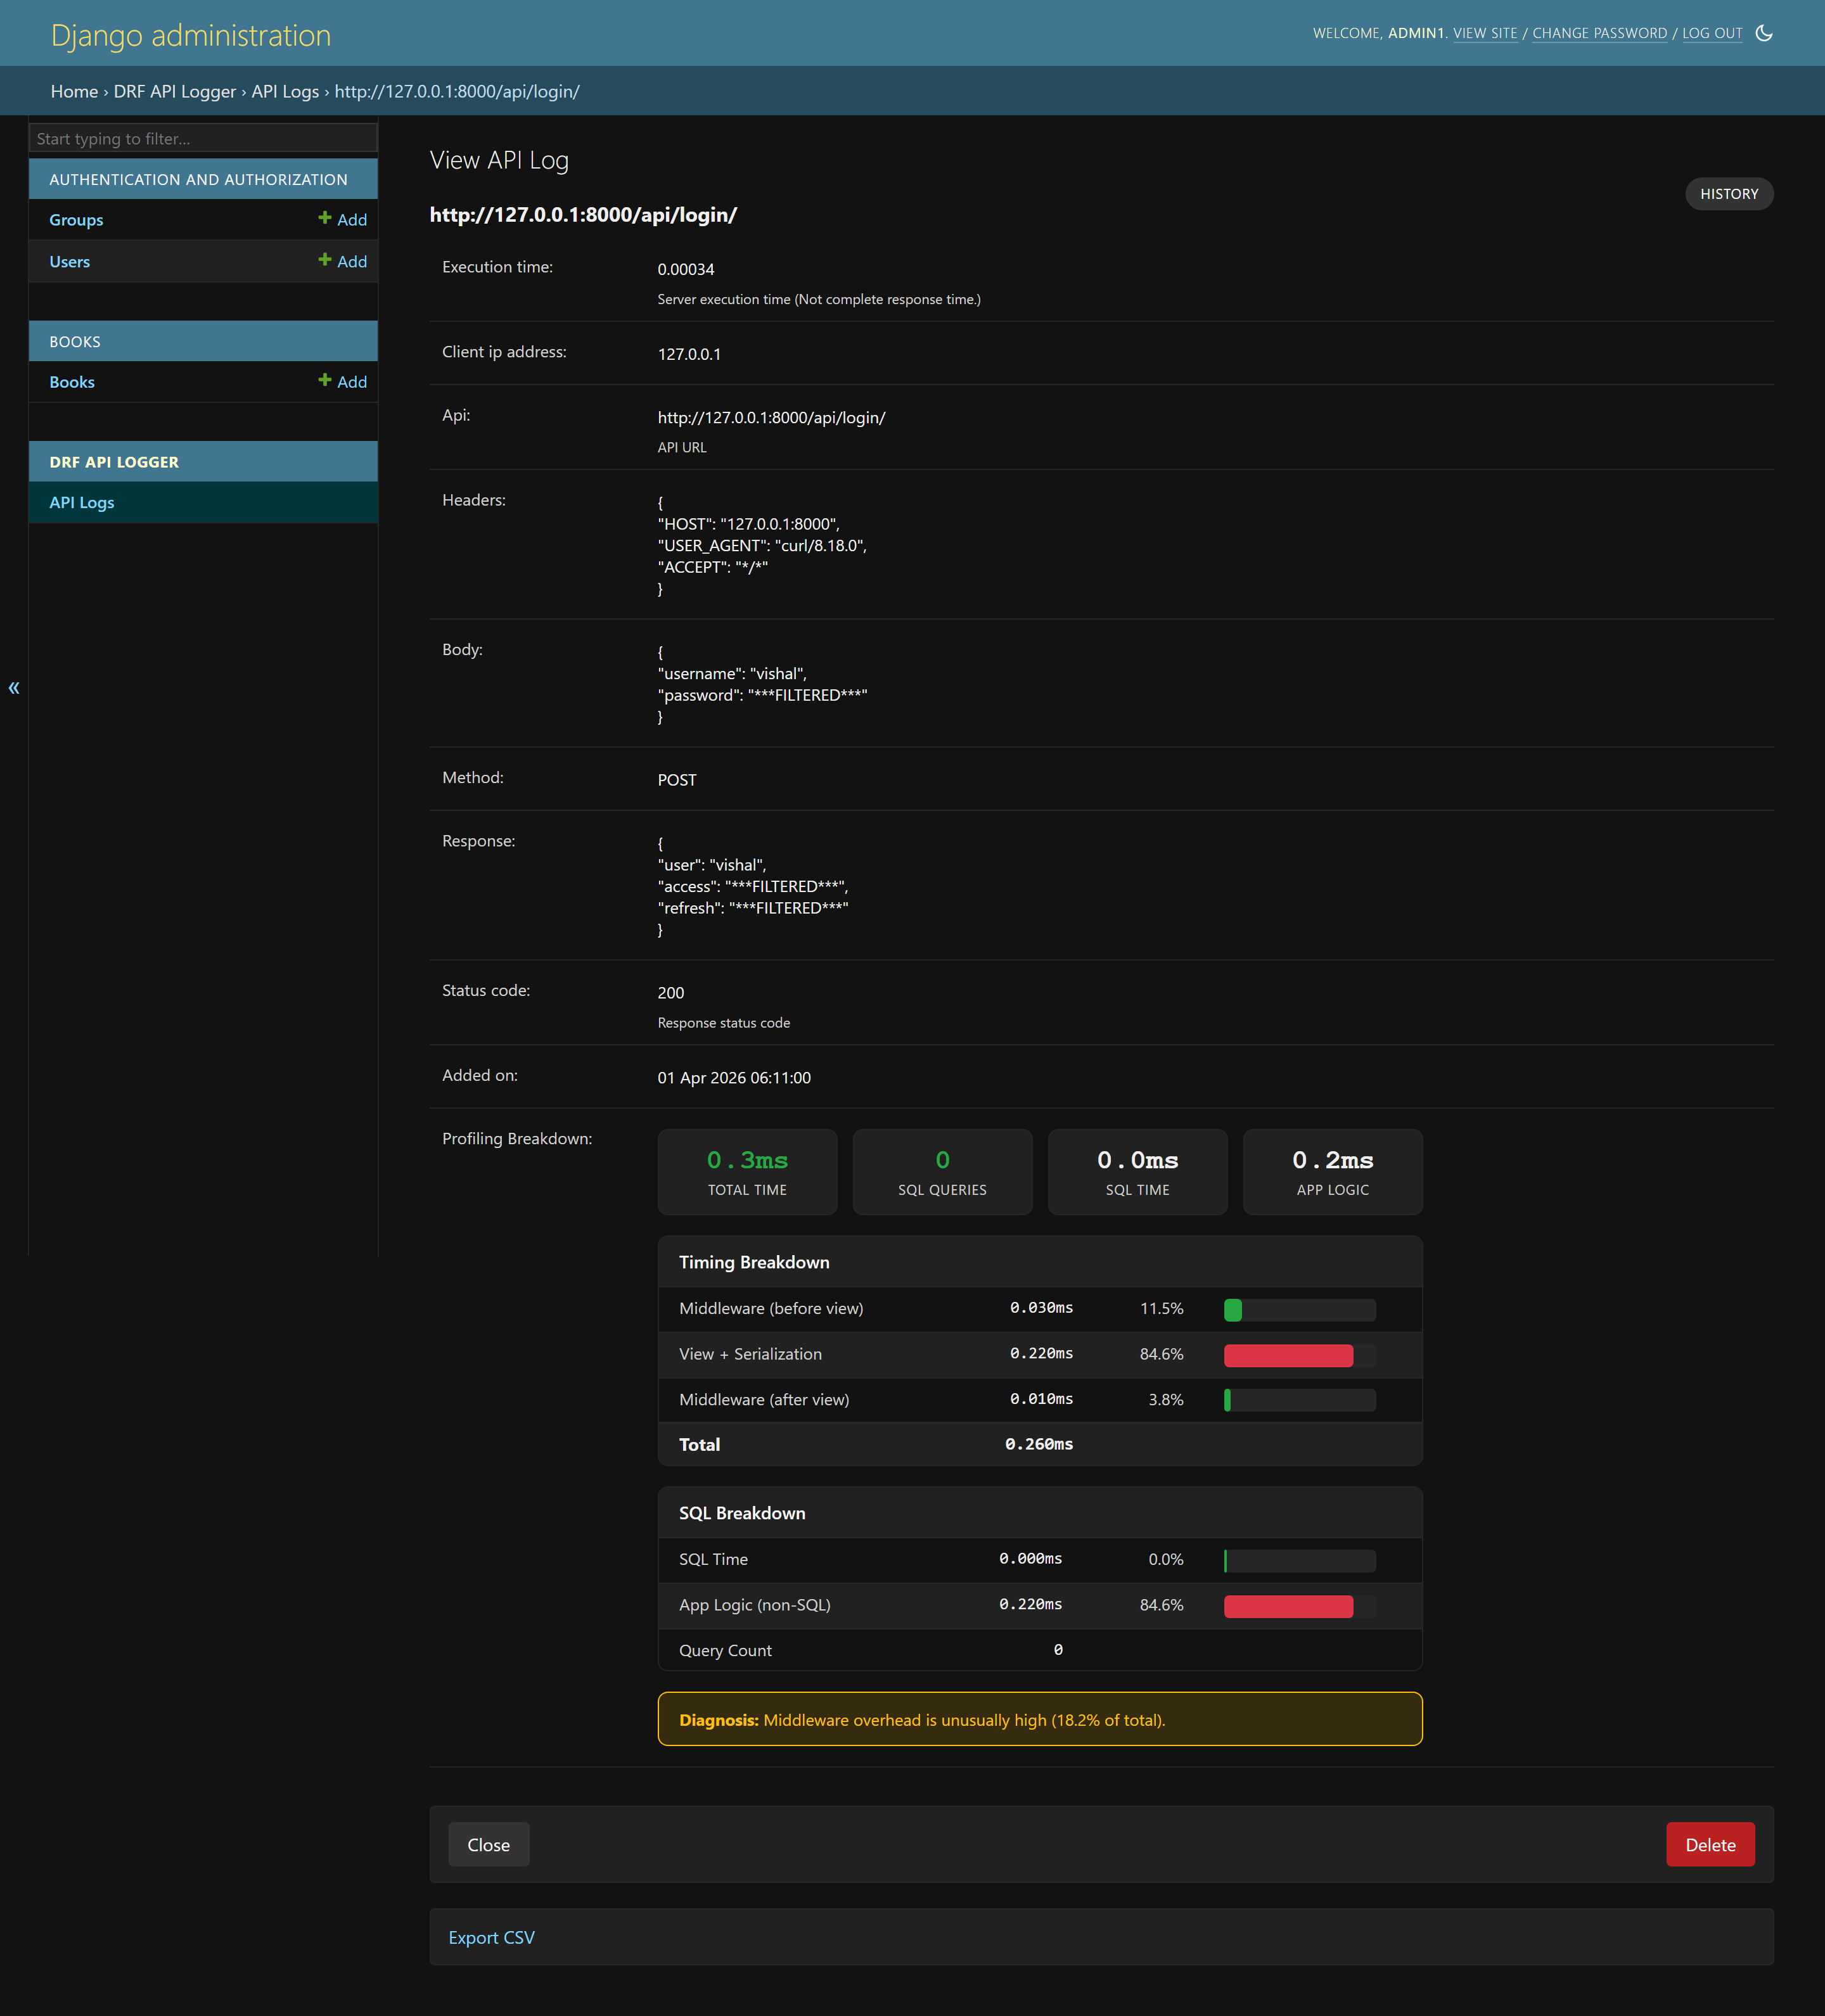
Middleware consuming 18.2% of total time. Sensitive fields (password, access, refresh) automatically masked.
Auto-Diagnosis Patterns
Pattern |
Diagnosis |
|---|---|
SQL > 70% of total + queries >= 10 |
N+1 query problem likely |
SQL > 70% of total + queries < 5 |
Few but slow queries - check indexes |
SQL < 20% + high total time |
Bottleneck in business logic or external calls |
Middleware > 10% of total |
Middleware overhead is unusually high |
Configuration Reference
Setting |
Type |
Default |
Description |
|---|---|---|---|
|
bool |
|
Enable database logging |
|
bool |
|
Enable signal-based logging |
|
bool |
|
Enable per-request profiling breakdown |
|
bool |
|
Track SQL queries (sub-toggle of profiling) |
|
float |
|
Fraction of logged requests that include profiling data |
|
int |
|
Bulk insert batch size threshold |
|
int |
|
Seconds between queue flushes |
|
list |
|
App namespaces to skip logging |
|
list |
|
URL names to skip logging |
|
list |
|
Log only these HTTP methods (empty = all) |
|
list |
|
Log only these status codes (empty = all) |
|
list |
JSON, gzip, binary, calendar |
Response content types eligible for body logging |
|
list |
|
Keys to mask with |
|
str |
|
Database alias for log storage |
|
int |
|
Slow API threshold in milliseconds |
|
int |
|
Max request body size in bytes ( |
|
int |
|
Max response body size in bytes ( |
|
str |
|
URL format: |
|
int |
|
Admin display timezone offset in minutes |
|
bool |
|
Enable request tracing IDs |
|
str |
|
Custom tracing ID generator (dotted path) |
|
str |
|
Header name to read tracing ID from |
|
bool |
|
Enable request correlation metadata without adding database columns |
|
list |
|
Headers checked for inbound request IDs |
|
list |
|
Headers checked for W3C traceparent or trace IDs |
|
str |
|
Dotted-path callback returning allowlisted opaque context IDs |
|
bool |
|
Expose correlation metadata through a ContextVar during the view call |
|
str |
|
Dotted-path function to transform or drop log entries before queueing |
|
bool |
|
Enable optional first-party metrics recorder |
|
str |
|
Metrics exporter: |
|
bool |
|
Enable API request count and duration metrics |
|
bool |
|
Enable detect-only suspicious activity metrics |
|
bool |
|
Enable optional internal Prometheus exposition view |
Note
Admin panel requests are automatically excluded from logging.
Selective Logging
Skip by Namespace
DRF_API_LOGGER_SKIP_NAMESPACE = ['admin', 'api_v1_internal']
Skip by URL Name
DRF_API_LOGGER_SKIP_URL_NAME = ['health-check', 'metrics']
Filter by HTTP Method
DRF_API_LOGGER_METHODS = ['GET', 'POST', 'PUT', 'DELETE']
Filter by Status Code
DRF_API_LOGGER_STATUS_CODES = [200, 201, 400, 401, 403, 404, 500]
Security & Privacy
Data Masking
Sensitive fields are automatically masked:
DRF_API_LOGGER_EXCLUDE_KEYS = ['password', 'token', 'access', 'refresh', 'secret']
# Result: {"password": "***FILTERED***", "username": "example_user"}
Default masking also covers common credential-bearing headers and keys including
authorization, cookie, set_cookie, api_key, x_api_key,
client_secret, private_key, sessionid, and
csrfmiddlewaretoken. Matching is case-insensitive and treats hyphens and
underscores equivalently.
Request Tracing
Enable tracing to add a unique ID to each request:
DRF_API_LOGGER_ENABLE_TRACING = True # Default: False
Access the tracing ID in views:
def my_api_view(request):
    if hasattr(request, 'tracing_id'):
        logger.info(f"Processing request {request.tracing_id}")
    return Response({'status': 'ok'})
Custom tracing ID generator:
DRF_API_LOGGER_TRACING_FUNC = 'myapp.utils.generate_trace_id'
Read tracing ID from request header:
DRF_API_LOGGER_TRACING_ID_HEADER_NAME = 'X-Trace-ID'
Request Correlation
Enable request correlation to connect API logger events with application logs, upstream gateways, distributed traces, or metrics labels:
DRF_API_LOGGER_ENABLE_CORRELATION = True
DRF_API_LOGGER_CORRELATION_REQUEST_ID_HEADERS = ["X-Request-ID", "X-Correlation-ID"]
DRF_API_LOGGER_CORRELATION_TRACE_ID_HEADERS = ["traceparent", "X-Trace-ID"]
DRF_API_LOGGER_ENABLE_LOGGING_CONTEXT = True
Correlation metadata is intentionally not stored in APILogsModel. Enabling
it does not add model fields, migrations, admin columns, database indexes, or
synthetic fields in queued database log rows.
When enabled, request handlers can read:
request.api_logger_correlationrequest.api_logger_low_cardinalityrequest.api_logger_request_idrequest.api_logger_trace_iddrf_api_logger.logging_context.get_correlation_context()
Signal listeners receive correlation and low_cardinality keys. Use the
low-cardinality dictionary for metrics tags such as route, URL name, and status
class. Keep high-cardinality request and trace IDs in logs or trace systems, not
metrics labels.
from drf_api_logger import API_LOGGER_SIGNAL

def forward_api_event(**kwargs):
    labels = kwargs.get("low_cardinality", {})
    correlation = kwargs.get("correlation", {})
    metrics.count(
        "drf_api_logger.request",
        tags={
            "route": labels.get("route"),
            "status_class": labels.get("status_class"),
        },
    )
    app_logger.info(
        "api request observed",
        extra={
            "request_id": correlation.get("request_id"),
            "trace_id": correlation.get("trace_id"),
        },
    )

API_LOGGER_SIGNAL.listen += forward_api_event
Add opaque, non-sensitive context through an allowlisted callback:
DRF_API_LOGGER_CORRELATION_CONTEXT_FUNC = "myapp.logging.api_logger_context"

def api_logger_context(request):
    return {
        "actor_id": getattr(request.user, "pk", None),
        "tenant_id": getattr(request, "tenant_id", None),
        "api_consumer_id": getattr(request, "api_consumer_id", None),
        "client_id": getattr(request, "client_id", None),
    }
Only actor_id, tenant_id, api_consumer_id, and client_id are
accepted from the callback. Do not return names, emails, tokens, or other
identifying values.
Path Configuration
DRF_API_LOGGER_PATH_TYPE = 'ABSOLUTE' # Default
Option |
Method |
Example Output |
|---|---|---|
|
|
|
|
|
|
|
|
|
Programmatic Access
Query log data when database logging is enabled:
from drf_api_logger.models import APILogsModel

# Successful API calls
successful = APILogsModel.objects.filter(status_code__range=(200, 299))

# Slow APIs
slow = APILogsModel.objects.filter(execution_time__gt=1.0)

# High SQL query count (requires profiling)
heavy_sql = APILogsModel.objects.filter(sql_query_count__gte=10)
Model Schema
class APILogsModel(Model):
    id = models.BigAutoField(primary_key=True)
    api = models.CharField(max_length=1024)
    headers = models.TextField()
    body = models.TextField()
    method = models.CharField(max_length=10, db_index=True)
    client_ip_address = models.CharField(max_length=50)
    response = models.TextField()
    status_code = models.PositiveSmallIntegerField(db_index=True)
    execution_time = models.DecimalField(decimal_places=5, max_digits=8)
    added_on = models.DateTimeField()
    profiling_data = models.TextField(null=True)            # JSON breakdown
    sql_query_count = models.PositiveIntegerField(null=True) # For filtering
Warning
Over time, the logs table will grow large. Use prune_api_logs for
dry-run-first batched deletion and add indexes to improve query performance.
Performance & Production
Run production diagnostics during deployment:
python manage.py drf_api_logger_doctor
python manage.py drf_api_logger_doctor --format json
python manage.py drf_api_logger_doctor --fail-level warning
The command is read-only and reports database readiness, queue health, payload
limits, masking configuration, and profiling risk. Use --fail-level error
when deployment checks should fail only on blocking misconfiguration.
# Use a dedicated database for logs
DRF_API_LOGGER_DEFAULT_DATABASE = 'logs_db'

# Optimize batch settings for high traffic
DRF_LOGGER_QUEUE_MAX_SIZE = 100
DRF_LOGGER_INTERVAL = 5
Prune old log rows periodically. Always run a dry run first:
python manage.py prune_api_logs --days 30 --dry-run
python manage.py prune_api_logs --days 30 --batch-size 1000
You can also prune before a fixed date:
python manage.py prune_api_logs --before 2026-06-01 --dry-run
python manage.py prune_api_logs --before 2026-06-01
Low request-path overhead from enqueue-only background processing
Observable queue backlog via
LOGGER_THREAD.get_status()for health checksEfficient storage (bulk database operations)
Production-safe profiling (
force_debug_cursoris thread-local,reset_queriesprevents memory leaks)
Example health check:
from drf_api_logger.apps import LOGGER_THREAD

def drf_logger_status():
    if LOGGER_THREAD is None:
        return {"enabled": False}
    return {"enabled": True, **LOGGER_THREAD.get_status()}